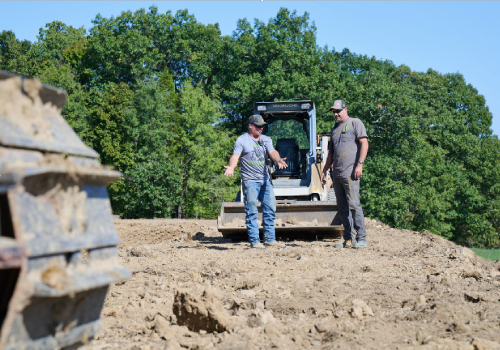
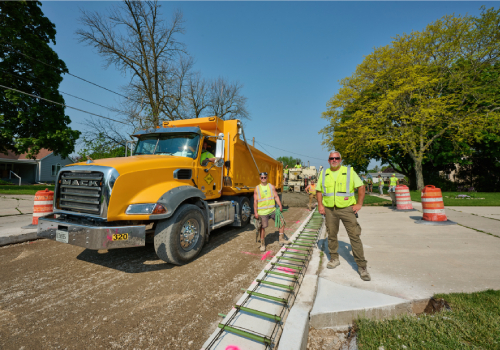
After a brief contraction a few years ago, the U.S. construction industry is employing more people in 2024 than it did back in 2019.
May 2023 employment data from the U.S. Bureau of Labor Statistics (BLS) shows that industry employment is back over 6.2 million people. It had dipped to roughly 5.85 million in 2021.
The job gains have continued into 2024, as well. As of May, roughly 250,000 construction jobs had been created over the past 12 months.
Wages have been climbing, too. BLS data shows that from May 2019 to May 2023, the average wage for a construction worker has risen nearly 30% to $26.77 an hour.
In other words, it is a great time to build a great career in construction.
Keep in mind that all of that data is on a nationwide basis. An individual’s job prospects often vary from state to state and city to city. As of April 2024, those prospects were looking pretty good in most places around the country.
Analysis from the Associated General Contractors of America (AGC) shows that construction employment rose in 61% (218) of the 358 metro areas over the past year.
For those individuals who are ready to find their next great job in construction, this article helps shed some light on where the best opportunities may lie based on several factors:
- Total construction employment
- Construction wages
- Population
- Quality of life
Which cities have the most employment opportunities?
When gauging construction employment opportunity, a good indicator for jobseekers is total employment level. BLS data from 2023 suggests that the following metro areas employ the most construction workers:
- New York City — 315,590
- Los Angeles — 184,070
- Houston — 177,050
- Dallas — 155,290
- Chicago — 135,380
- Phoenix — 116,950
- Washington, D.C. — 109,380
- Miami — 103,120
- Boston — 98,700
- Seattle — 95,880
- San Francisco — 89,290
- Philadelphia — 86,600
- Riverside, CA — 81,140
- Atlanta — 80,210
- Denver — 72,940
For those with construction industry experience who are qualified to seek a leadership position, BLS data from 2023 suggests that the following metro areas offer the most opportunity for construction managers:
- Houston — 14,660
- Dallas — 12,320
- New York City — 12,080
- Chicago — 11,970
- Los Angeles — 11,390
- Denver — 8,040
- Phoenix — 6,720
- Miami — 6,520
- Boston — 6,470
- Washington, D.C. — 6,170
- Charlotte — 6,060
- San Francisco — 5,910
- Orlando — 5,010
Which cities have the highest wages for construction workers?
In addition to seeking out locations with ample employment opportunity, aspiring construction professionals should also think about which markets pay above-average wages.
BLS data from 2023 shows that 200 metro areas have been paying at least the national average of $26.77 per hour. The following are the highest-paying metro areas for construction workers:
- San Jose, CA — $42.60
- San Francisco — $41.73
- Seattle — $39.75
- Honolulu, HI — $39.15
- Boston — $39.11
- Chicago — $38.57
- Mount Vernon, WA — $38.33
- New York City — $37.83
- Kahului, HI — $37.48
- Vallejo, CA — $37.19
- Kennewick, WA — $37.17
- Trenton, NJ — $37.07
- Santa Rosa, CA — $37.06
Which cities have the most population?
An important driver of construction activity is population. The larger the population and the faster it is growing, the more need there is for investment in housing, infrastructure and other amenities.
The most recent U.S. Census Bureau data from July 2023 shows the following cities as the most populous:
- New York City — 8,258,035
- Los Angeles — 3,820,914
- Chicago — 2,664,452
- Houston — 2,314,157
- Phoenix — 1,650,070
- Philadelphia — 1,550,542
- San Antonio — 1,495,295
- San Diego — 1,388,320
- Dallas — 1,302,868
- Jacksonville, FL — 985,843
- Austin, TX — 979,882
- Fort Worth, TX — 978,468
- San Jose, CA — 969,655
- Columbus, OH — 913,175
- Charlotte — 911,311
The following metro areas saw the most population growth from July 2020 to July 2023:
- San Antonio — 56,038
- Fort Worth, TX — 54,866
- Port St. Lucie, FL — 38,206
- Phoenix — 37,611
- Charlotte — 35,559
- Jacksonville, FL — 33,963
- Cape Coral, FL — 29,033
- Georgetown, TX — 27,563
- North Las Vegas — 23,557
- Frisco, TX — 22,253
- Oklahoma City — 19,689
- New Braunfels, TX — 19,315
- Leander, TX — 19,207
And the 10 best cities for construction jobs are …
Based on a combination of the criteria analyzed above, the following U.S. cities are the best to begin building a rewarding career in construction:
- New York City
- Chicago
- San Francisco
- Boston
- Seattle
- Phoenix
- Los Angeles
- Houston
- Dallas
- Philadelphia
Construction industry jobseekers can also start their career search by simply identifying those states with the greatest prospects for a rewarding construction career.
Ten states have really stood out based on their combination of employment levels, wages, economic activity and population.